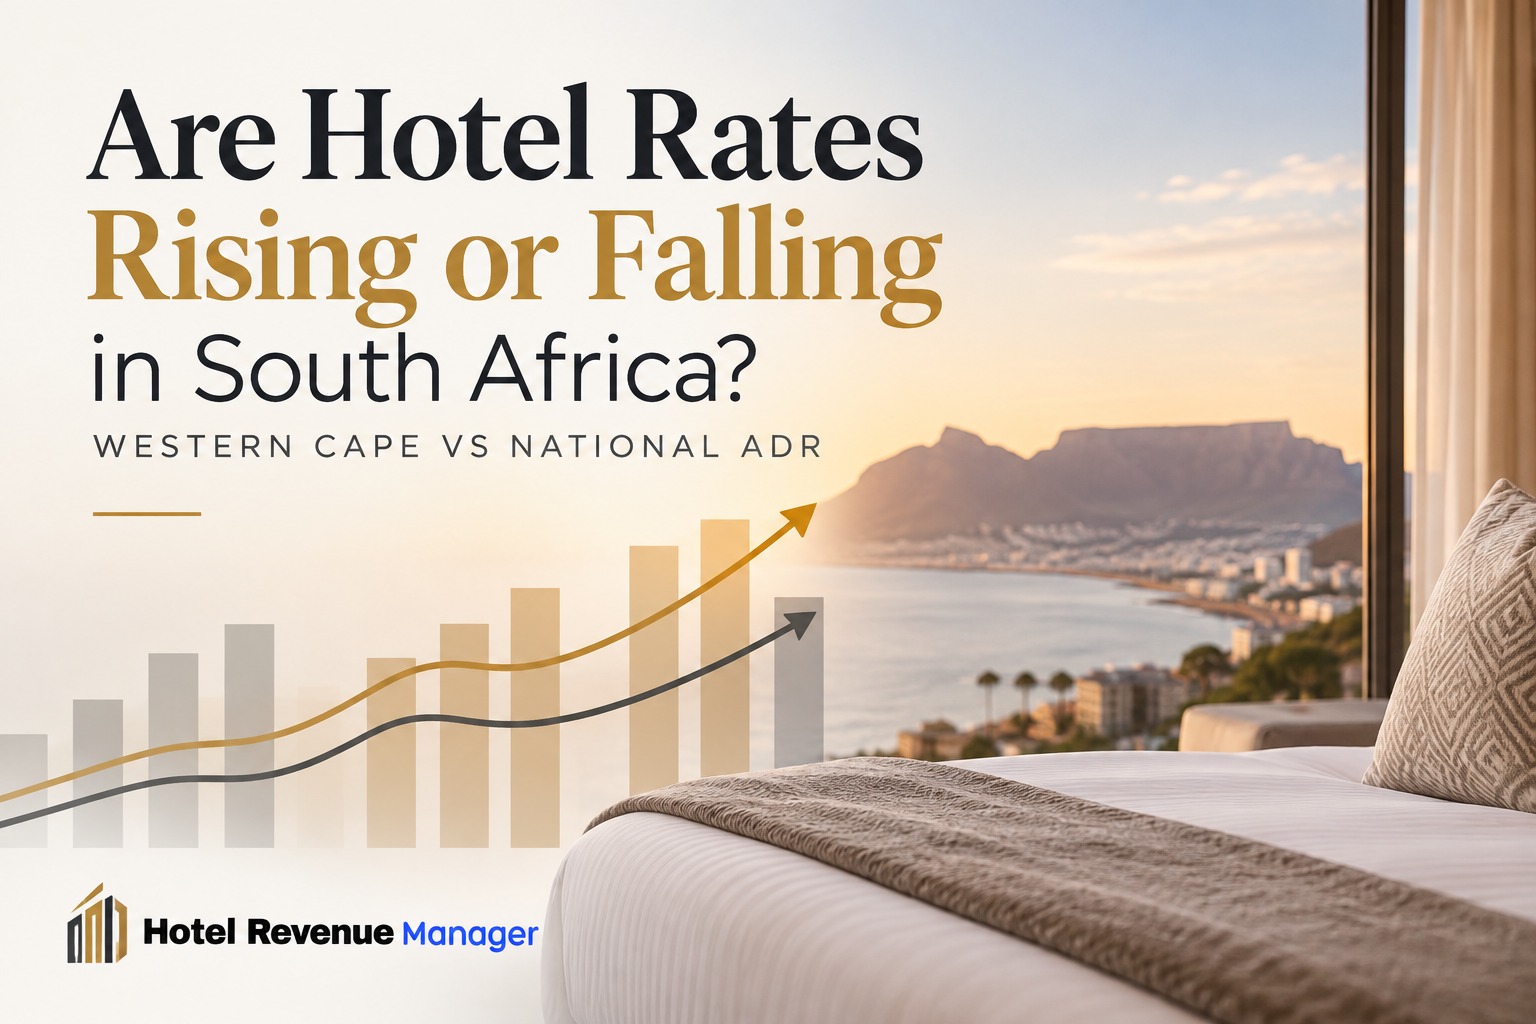

IN SHORT Hotel rates have risen across South Africa, and faster in Cape Town than nationally. In the months checked in 2025, Cape Town’s average daily rate (ADR) grew roughly 14–16% year on year in rand terms, against roughly 6–9% nationally. CoStar’s Cape Town report of 16 September 2026 shows ADR still up 11.8% year to date in US dollars, but occupancy is down 3.3%, so RevPAR growth has slowed to 8.2% from 14.4% in 2025. ADR benchmarks are averages shaped by luxury hotels, so measure yourself against your own class and comp set.
Hotel rates in South Africa have been rising, and the Western Cape has led the way. Through 2025, Cape Town’s ADR grew faster than the national average in every month checked, and CoStar’s latest Cape Town report shows rate growth continuing into 2026, with occupancy now slipping.
How much higher is ADR in Cape Town than nationally?
Cape Town’s ADR sat well above the national figure in every month checked in 2025, and the gap widened as the year went on. Cape Town’s ADR also grew faster than the national figure in all three months, and the premium rose from 66% in May to 83% in October.
| Month (2025) | National ADR | Cape Town ADR | Cape Town premium | Cape Town ADR YoY | National ADR YoY |
| May | R1,747 | R2,899 | +66% | +13.9% | +8.5% |
| August | R1,745 | R3,061 | +75% | +16.1% | +5.7% |
| October | R2,002 | R3,673 | +83% | +15.1% | +9.0% |
Source: STR/CoStar monthly hotel performance data, as reported by industry press. Cape Town premium calculated by Hotel Revenue Manager from the ADR figures shown. Rand, not adjusted for inflation.
What has happened to Cape Town rates in 2026?
CoStar’s Cape Town hospitality report, dated 16 September 2026, shows rate growth continuing in 2026 but occupancy slipping. Year to date, ADR is up 11.8% and occupancy is down 3.3%, so RevPAR is up 8.2%, against growth of 14.4% across 2025. Hotel supply grew 2.7% year to date while demand fell 0.6%.
| Cape Town hotels | 2025 full year | 2026 year to date |
| Occupancy | 66.6% (+1.6%) | 62.8% (−3.3%) |
| ADR (US$) | $182.92 (+12.6%) | $200.77 (+11.8%) |
| RevPAR (US$) | $121.80 (+14.4%) | $126.16 (+8.2%) |
Source: CoStar Cape Town Hospitality Submarket Report, 16 September 2026. US dollars. Percentages in brackets are changes on the same period of the previous year. Levels are not like-for-like because 2026 covers only part of the year, so compare the changes.
These figures are in US dollars, so part of the ADR movement reflects the rand/dollar exchange rate. They cannot be compared directly with the rand figures in the table above.
What is driving the rate growth?
Mainly the top end of the market. CoStar’s Cape Town data puts luxury and upper-upscale ADR at about US$260 year to date in 2026, against about US$113 for upscale and upper-midscale hotels and about US$66 for midscale and economy, so rate growth at the top has an outsized effect on the city average. Supply has also grown slowly: between 2019 and 2025, Cape Town’s hotel inventory grew about 9% (from 16,050 to 17,447 rooms), while ADR in US dollars rose about 81%.
These figures are not adjusted for inflation, so real growth is smaller than the headline percentages suggest.
Are rates rising across all hotel classes?
Rates are rising in every class, but occupancy is falling in each. Year to date, ADR is up 15.8% in midscale and economy, 9.1% in luxury and upper upscale, and 8.4% in upscale and upper midscale. Occupancy is down 7.4%, 4.7% and 0.3% respectively. Luxury RevPAR growth has slowed to 3.9%, the weakest of the three, because the occupancy decline offsets most of the rate gain.
| Class (2026 YTD) | Occupancy (change) | ADR (US$) | ADR change | RevPAR change |
| Luxury & upper upscale | 62.7% (−4.7%) | $259.90 | +9.1% | +3.9% |
| Upscale & upper midscale | 65.5% (−0.3%) | $113.42 | +8.4% | +8.0% |
| Midscale & economy | 51.1% (−7.4%) | $66.42 | +15.8% | +7.2% |
Source: CoStar Cape Town Hospitality Submarket Report, 16 September 2026. US dollars, year to date.
A hotel benchmarking against the Cape Town average without adjusting for its class can easily misjudge its own position.
How should a hotel use ADR benchmarks?
- Compare like with like. Benchmark against your comp set and your own class, not the citywide average.
- Compare the same period. Seasonality is large: Cape Town’s hotel occupancy was 53.4% in June 2025 and 77.5% in October 2025, and a year-to-date figure covers a different mix of months from a full-year one.
- Read ADR alongside occupancy and RevPAR. Rate gains can be offset by falling occupancy: in 2026 so far, Cape Town ADR is up 11.8% but RevPAR only 8.2%. RevPAR index against the comp set shows whether higher rates are being converted into revenue.
- Check the currency and the inflation effect. Rand and US dollar figures move differently, and neither set is adjusted for inflation.
What should we expect for the rest of 2026?
The 2026 data shows rate holding up while occupancy weakens: ADR is up 11.8% year to date, occupancy is down 3.3%, supply is growing and demand is slipping. That is consistent with forward bookings running behind last year’s pace and with the disruption to long-haul routes via Dubai. It is not a forecast, and the report does not include one. New hotel supply is limited, with only 269 rooms (1.5% of inventory) under construction, so the pressure on occupancy is not coming from new hotels. Short-term rental supply, which this report does not cover, is the other factor to watch. Rate growth has so far offset lower occupancy, and the RevPAR index against your comp set will show whether that holds for your hotel.
Where does this data come from?
The 2025 monthly figures are STR/CoStar data for South Africa in rand, as reported by industry publications. The 2025 full-year and 2026 year-to-date figures are from CoStar’s Cape Town Hospitality Submarket Report dated 16 September 2026, which is in US dollars. Premiums and ratios were calculated by Hotel Revenue Manager from these figures. Treat them as indicative market benchmarks, and use your own property data and rate-shopping data for pricing decisions.
Hotel Revenue Manager provides outsourced revenue management and tourism business intelligence to independent hotels across South Africa, based in Cape Town.