Insights by Hotel Revenue Manager collects data from 16 000 rooms. Various levels of hotels all around the Cape Town metro share their info and we accurately portray the city’s forward book and demand patterns. Trading have changed the past 1-2 years and new patterns have emerged and any hotelier, owner or revenue manager needs as much info as possible, in order to pin rates at anticipated demand to get the best possible conversion. Whilst we realise some upper segment hotels might not be anywhere close to this report one should take note of overall market movement as the same will apply but at different ADR or Occ levels.
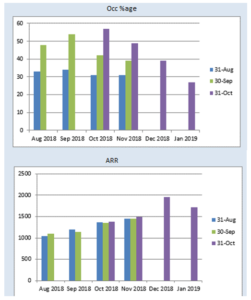
October reports have been finalised at 57% occupancy (vs 54% in Sep). The month of October had a 20-25% occupancy increase during the month and highest to date since we crawled out of winter trading. Nov is looking positive after gaining 10% in occupancy during October and starts at 49% and rate grew with R45 or 10% . With Africom week most hotels are running full since Fri last week (9 Nov) until Thu 15th Nov . Occ drops to a low 40-50% occ not much demand for next week 20-24th. The last week of Nov picks up to mid 60’-70s % until 5 Dec.
Dec starts at average 40% occ and 1-5 is looking strong but 6 Dec to 19 Dec is very quiet (around 30% occ) all over the metro with majority doing 60-70% from 20th to 5 Jan 2018. The anomaly is that the rate or occupancy hardly moved for 2-3 weeks that passed.
Our advice is to hold off the restrictions and favour free flow of bookings at a market related rate (in middle of compset rate-wise) and enforce at least 50% prepayment where possible. There are still plenty deals and availability out there and guests aren’t stupid – so be gentle with the extra demand – they(the buyers) are watching!
Want more? want to benchmark your own compset?